


Top 3 Manufacturing Dashboards on Your Shop Floor
Data & Analytics
October 31, 2022


[Last Updated On: February 8, 2023]
Shop floor dashboards are not new to the business world. But with factory management teams moving towards digitization, Industry 4.0 solutions are now connecting the shop floor with the top floor. Digital transformation efforts are offering opportunities for all manufacturing roles to collaborate and work more efficiently across their organization.
In this blog, learn the advantages to replacing manual data collection with real-time digital dashboards through these questions:
A manufacturing dashboard displays key metrics in a visual way that allows teams to measure, monitor and manage the effectiveness of their work while progressing towards strategic objectives. There are several types of dashboards, each pulling data from a variety of sources and then visualized in a clean format.
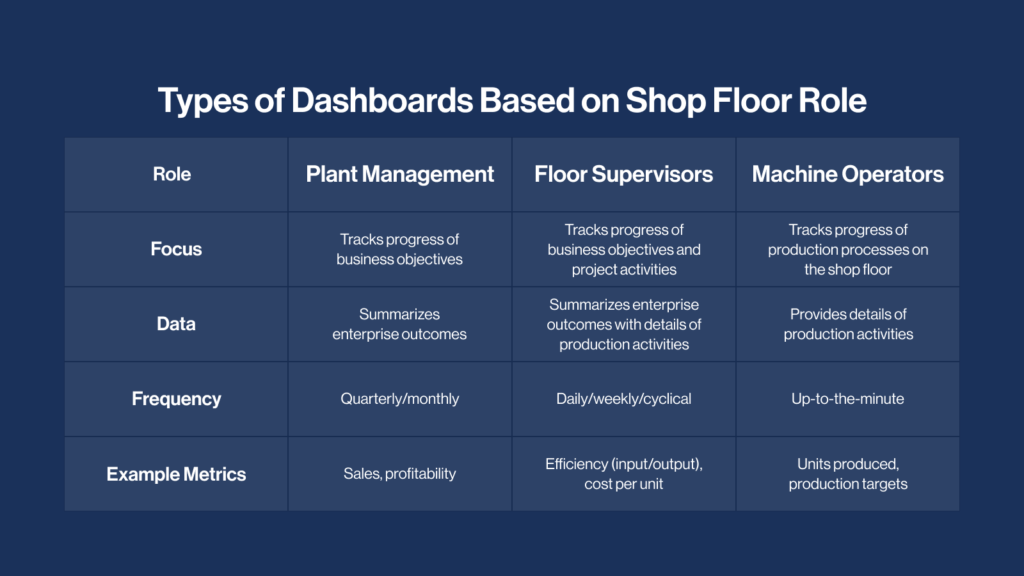
The three main types of dashboards with industrial applications include: strategic, tactical and operational dashboards. In the factory setting, there are three significant roles that determine the type of dashboard that can be implemented.
Many shop floor dashboards are displayed on whiteboards and manually created with data from spreadsheets. The result? An inefficient and inaccurate method of solving immediate shop floor problems. The best way for your factory to remain competitive is to move to real-time, digital dashboards.
When manual processes are replaced with digital, your Industry 4.0 tech stack can perform stronger and provide real-time insights to make sustainable plant-wide improvements. There are four reasons why you should make the switch from Excel to shop floor dashboards:
Participatory design is a concept to describe when operators are engaged and involved in co-designing production processes and reporting methods at their workstation. A use case for this is by empowering them to easily capture data that can help them make decisions. For example, implementing a solution, like Raven, helps operations teams to categorize periods of downtime in real-time and can display it on a dashboard.
Their input provides more complete and accurate data, which is often missed when using manual processes or other digital platforms. With the touch of a button, Raven makes it easy for operators to input their context, including changeover details.
An operations dashboard includes OEE improvement initiatives and efficiency metrics that can help pinpoint areas for improvement. Raven’s Changeover Module helps enhance the dashboard by tracking and monitoring changeover efficiency in relation to targets, and identifies areas of opportunity to decrease time wasted on changeover.

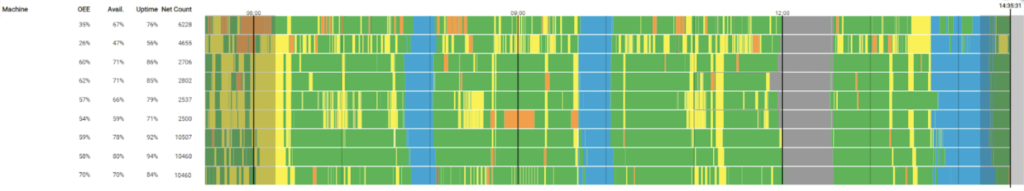
An event timeline where both production and downtime is shown gives shop floor teams the ability to uncover hidden inefficiencies. Raven’s contextualized timeline accounts for 100% of production time and losses. Factories can use a contextualized timeline to highlight constraints, bottlenecks and root causes of downtime at a glance.
The timeline is automatically created using valuable human context from operators — only when machines don’t have the answers. As one source of truth, teams get the full picture into their machines’ performance and can identify key opportunities for daily operational improvements.
In addition to recording and displaying downtime, operator dashboards can be used for self moderated performance and skill-building.
Learning and development plays an important role in work-life satisfaction on the shop floor. When operators have real-time dashboards at their workstation, they know where they stand on their day-to-day responsibilities and feel more confident in their tasks because they:
In addition to learning and development, Forbes states that teams who score in the top 20% in engagement realize a 41% reduction in absenteeism and 59% less turnover. Engaged employees show up every day with passion, purpose, presence, and energy.
By placing dashboards in easy-to-view locations on the shop floor, progress statuses are available for every team member. An end-of-line dashboard is perfect for operators and supervisors to have the metrics that matter to them on display for target progress and shop floor conversations.
The Ahead or Behind Module is part of an operator or supervisor dashboard that easily monitors the status of line schedules. The customizable dashboard displays target progress, production tracking and changeover monitoring.
With performance metrics top of mind, the frontline knows how their work is impacting plant goals.
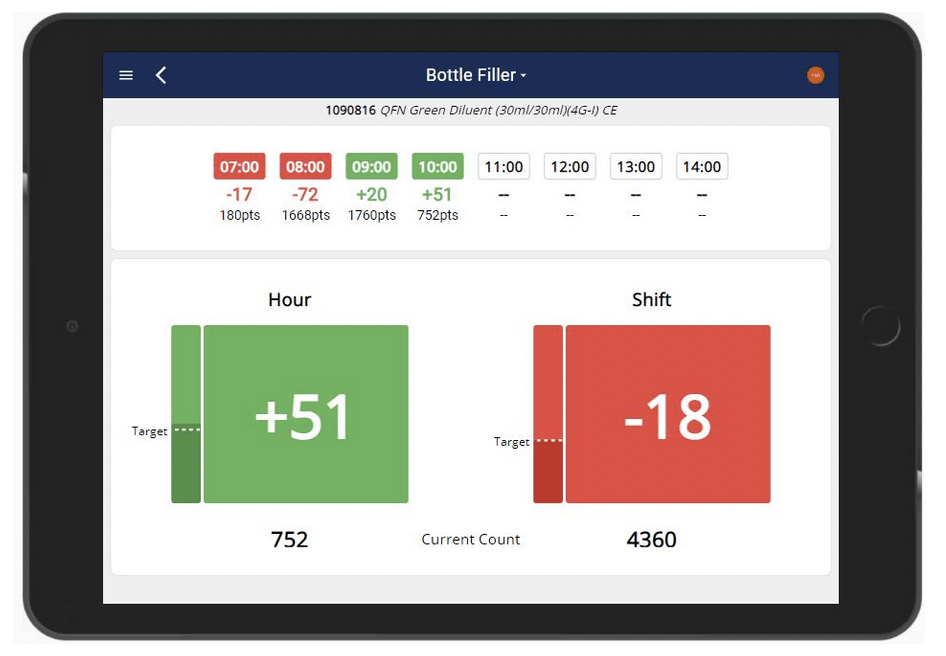
The ahead or behind view allows operators to know if they’re on track to meet their hourly and shift targets while providing positive feedback (green) when targets are met. Tablets can be located at an operator’s workstation or on large screen displays on the shop floor.
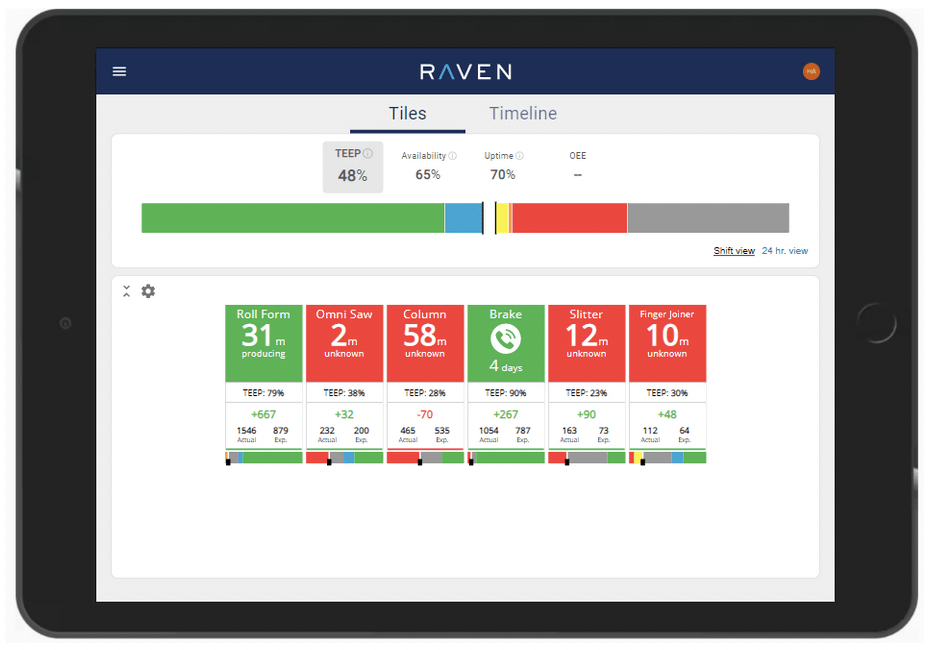
The ahead or behind view on supervisor dashboards displays all of your machines’ schedules for shop floor management. It allows supervisors to assess whether or not they are meeting targets for each production process. Shift timelines allow this dashboard to identify processes with systemic and real-time issues so maintenance teams can resolve them fast.
Supervisor dashboards can be viewed on desktop or mobile for supervisors to stay up-to-date on shop floor happenings.
When teams are in the green and hitting targets, they celebrate their accomplishments together. When teams are having trouble with targets, they can use the dashboard to drive collaborative conversations around how they will get there – leading to more exciting wins! This can be done through leaderboards along with some friendly competition.
A manufacturing leaderboard can be a list of employees or shifts that are ranked in order to identify levels of production or completion of targets. They are usually designed with a competitive progress indicator and shared for both comparison and motivation.

Gamification through the use of technology needs to be human-centric. Below are some examples of gamification that could be used in your manufacturing plant.
Enhance decision-making
Improve quality
Personal progress
When the shop floor is engaged, we can tap into the competitive fires we all have. Teams feel a greater sense of accomplishment and are more willing to go the extra mile. By using technology to motivate teams and make their jobs more fulfilling, targets get hit and results spike.
Learn how you can improve your own production efficiency on the shop floor, with automated processes and real-time dashboards.